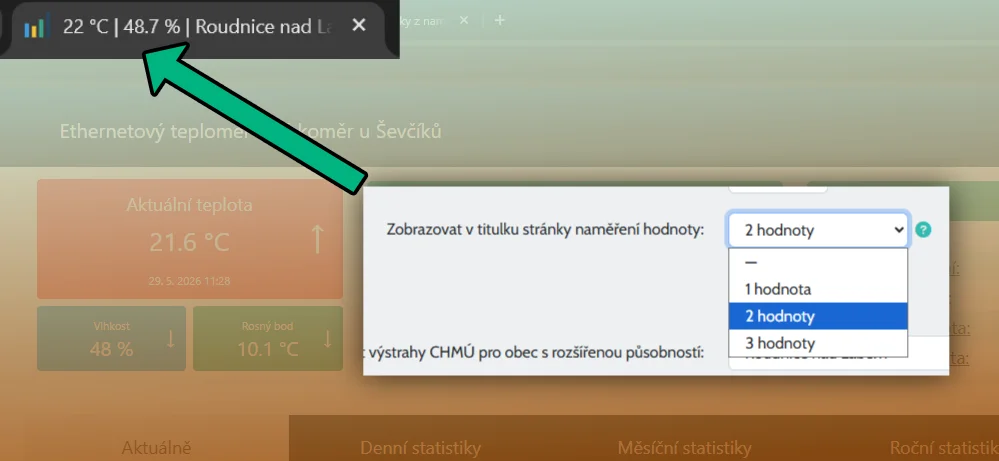
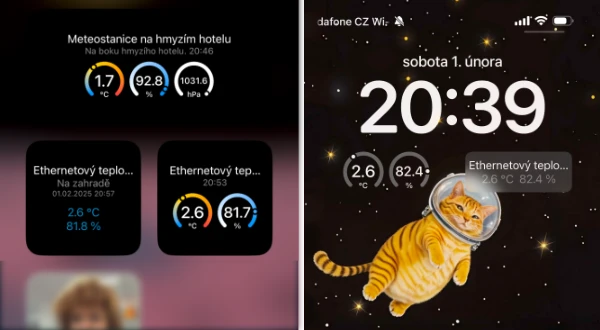
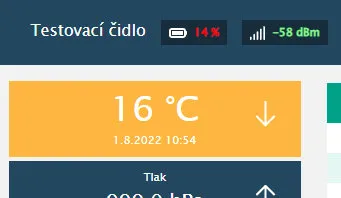
Measured values in the sensor page title
In the sensor settings (on the "Web display" tab) you can now enable that the page title (and therefore also the browser tab) of the statistics page shows the latest measured values with their units. You can choose 1, 2 or 3 values (depending on how many your sensor sends and you want to see there). The values are automatically refreshed together with the rest of the live data on the page, so your browser tab always reflects the current measurements.
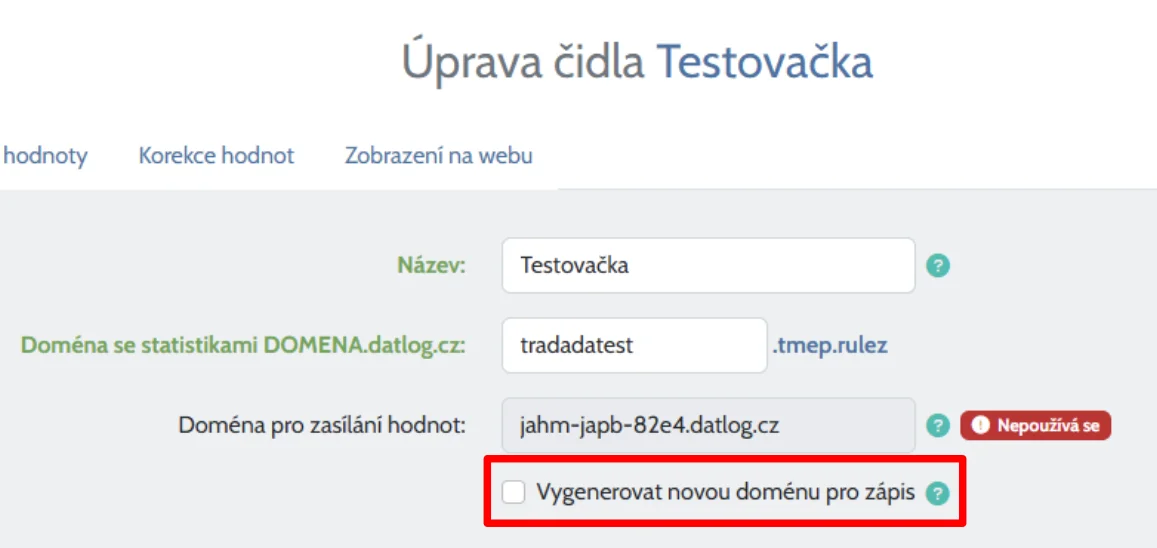
Option to generate a new domain for sending values
In the sensor settings, you can now re-generate a new domain for sending values from your device. This is useful, for example, if you suspect that your existing write domain has been compromised. After ticking the option you have to confirm it and be aware that the newly generated domain must also be set directly in your device (sensor), otherwise measurements will stop arriving as the current domain will stop working.
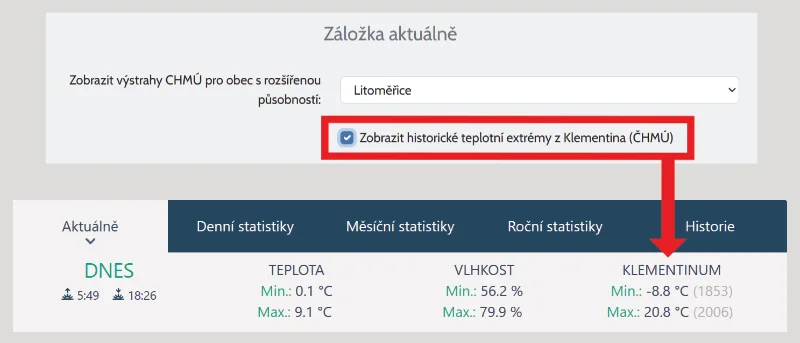
Historical temperature extremes from Klementinum
On the "Currently" tab, you can now display historical temperature extremes from Prague's Klementinum observatory (source: ČHMÚ , data since 1775). For each day of the year, you will see the historical minimum and maximum, so you can compare current weather with long-term records. You can enable this feature in the sensor settings on the "Web display" tab.
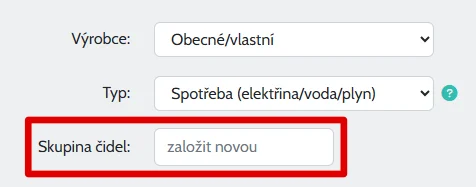
Sensor groups
Do you have multiple sensors under your account and need to keep them organized? You can now sort them into groups to make it easier to navigate them in the administration.
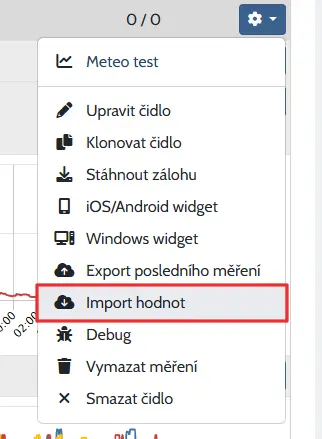
Reimport values
In the administration section under a specific sensor, you will find a link to import values. TMEP treats imported values retroactively by recalculating some statistics for faster display of important values—that is why retroactive import is a bit tricky and it is necessary to handle various cases that may arise. For this reason, the import was not available before, but based on demand, I have added it now. Please note that the values you import have several rules that need to be followed (in addition to the CSV file format, among other things, it is necessary to include all values for imported hours for older days, etc. within the import) - you can find out everything in the documentation here .
Support for COMET System sensors
It is now possible to send data from COMET System sensors to TMEP. How to set up the device and sensor in the administration can be found in the documentation here (Czech language) .
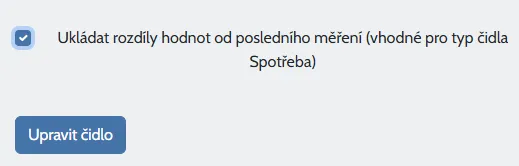
Setting to store the difference between last and previous value
Do you need to measure the consumption, but you can't send the difference since the last measurement to the server, only the total? With this function, the server calculates the difference and stores it. The function can be activated at the sensor on the “Value correction” tab.
New version of app for iOS
The main feature of the new version 1.2.1 is the ability to choose a new graphical widget in addition to the text one. Both can also be placed on the lock screen.
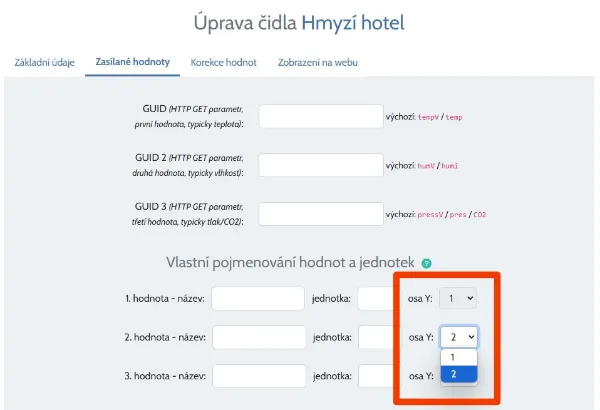
Common Y axis
If you need to display values on a common Y-axis, you can now do so by editing the settings under "Custom Values". This is particularly useful if you are sending multiple temperatures and need to compare them on the same scale. You can then assign a second and/or third value to the first axis.
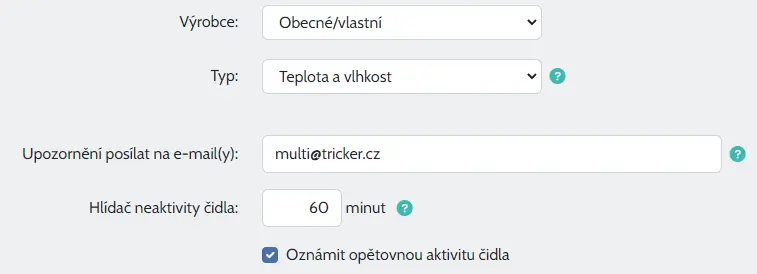
Email alerts to multiple custom addresses
A requested function has been added - alerts on sensor inactivity or battery voltage drop can now also be sent to other e-mail addresses than the main one to which the account is linked. If you need to alert someone else in the family or company, it is now no problem and you can specifically write the addressees for each sensor to be notified as you wish.
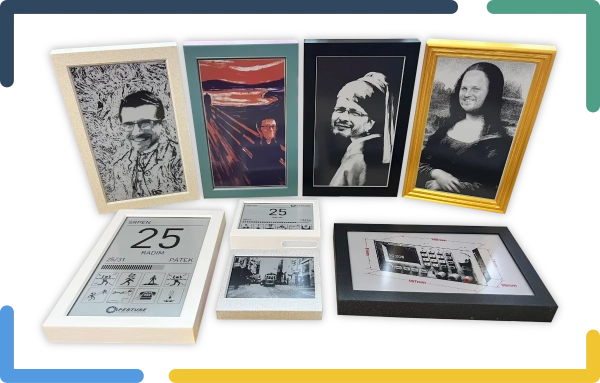
Živý obraz - new service connected even with TMEP
At zivyobraz.eu you will find a service that allows you to view any information on an e-ink display.
The device can last well over a year on battery power with several refreshes a day - depending on the type of ePaper and the size of the battery. You have the option to display your own images from the gallery, ready-made full screens with e.g. weather forecasts, or create your own screen in the web editor. You can put a lot of information on it - date, holiday, currency rates, weather information, Apple/Google/Microsoft calendar listing and much more.
You can also send information to the Screen from your home automation to the server, for example, or simply link the output from TMEP to place not only your current measurements on the Screen, but also graphs from the history of those measurements.
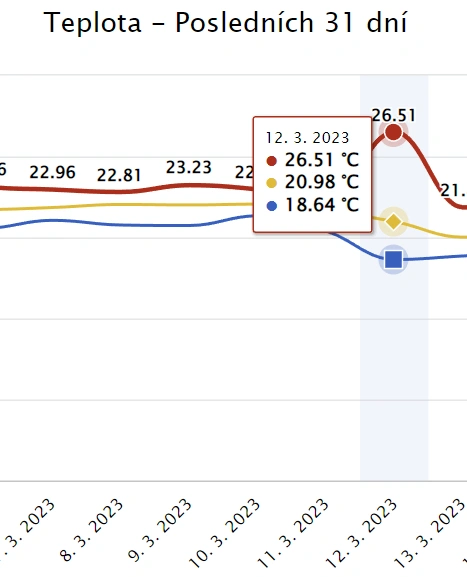
Improvements on charts - values above the curve
The daily/monthly/annual statistics show values above the peak curve for a longer period of time. Now you can hover over the other curves to see the values. Also, now the minimum/average/maximum values appear together in the window for comparison when you hover over a column, not just one specific one.
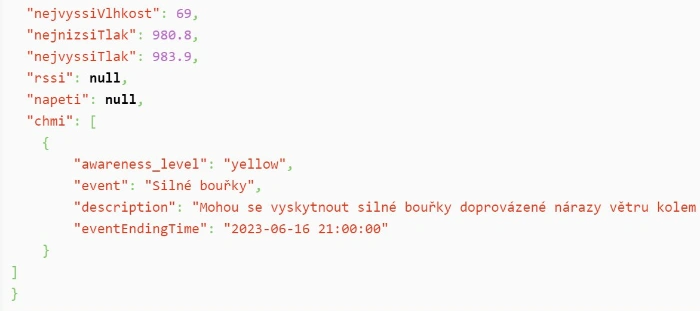
Warnings from CHMI in JSON export
Do you get values from TMEP e.g. for an external display? Then it might be nice to have a warning from CHMI about the current situation. Now it is possible! They could be included in the export.
Further information on how to do this can be found in the documentation here .
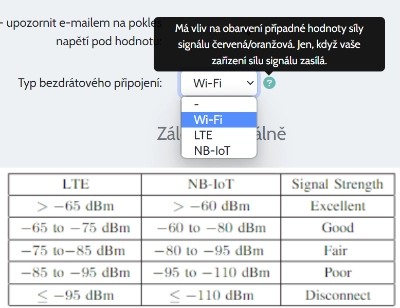
Setting up the technology for the wireless signal
A small detail, without which the application would show nonsense. If you have a sensor connected wirelessly, it sends the signal strength and you are connected other than via Wi-Fi, so coloring the signal strength might not make sense. Typically for NB-IoT, the ranges where the signal is still OK compared to Wi-Fi/LTE are shifted quite a bit and the original signal shown in red was still OK. You can now fine tune this nuance by setting the correct technology at the sensor.
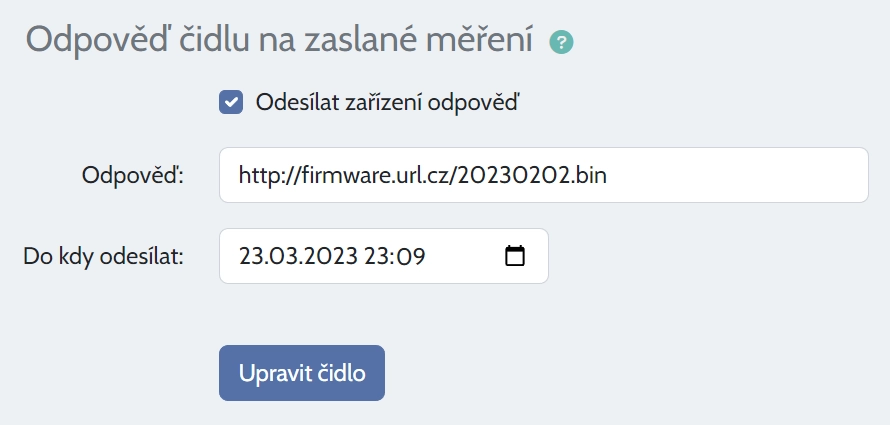
Send response to sensor
Do you need to send some value back to the device? Whether it's a temperature for the thermostat, or perhaps a new firmware address for an upgrade - no problem!
In the sensor settings in the "Values with measurements", you can let any value be sent back and, if necessary, limit it until when it is sent with date and time.
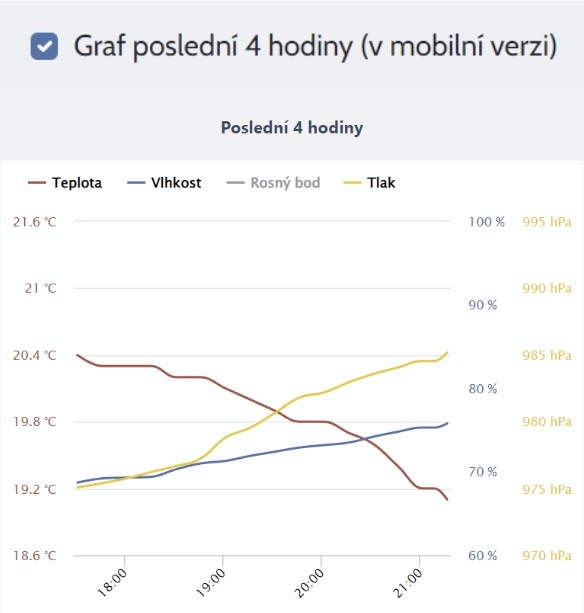
Optional graph "Last 4 hours" (mobile version only)
Do you want to see the last hours in more detail when viewing statistics on your mobile phone? No problem, turn on the chart of the last 4 hours for the mobile version. The option can be found in the sensor settings under the "Web settings" tab.
Support for Ecowitt gateways
Thanks to Roman Hošek and his help in implementation, you can now connect the popular Ecowitt gateways to TMEP.
The instructions and specific information on how to do this can be found (as usually) in wiki here.

Instructions for Olimex ESP32-POE
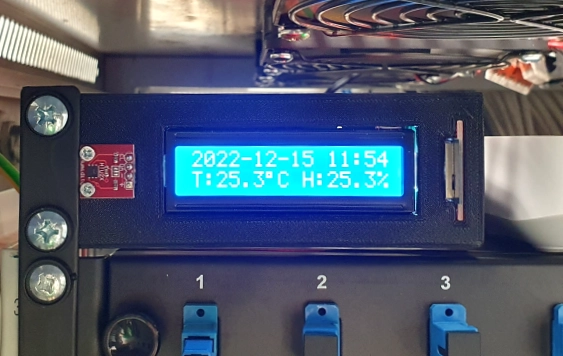
Complex example of tinkering with Olimex ESP32-POE module, display, 3D printed holder and ESPEasy firmware by Roman Mikulka.
Keep an eye on the server room with TMEP.
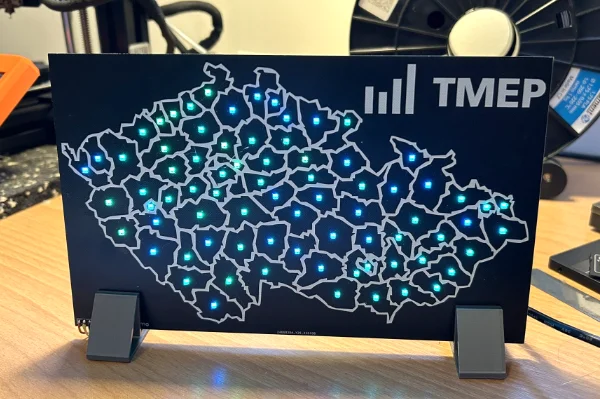
LED map of districts connected to TMEP
The brilliant inventor Tomas Břinčil came up with a map of the Czech Republic divided into districts, where every district is one addressable LED. If you are a maker, you have the possibility to animate this map and get the measured values from TMEP from special outputs designed just for it.
Further information and links for a more detailed description of the project can be found at na wiki zde.
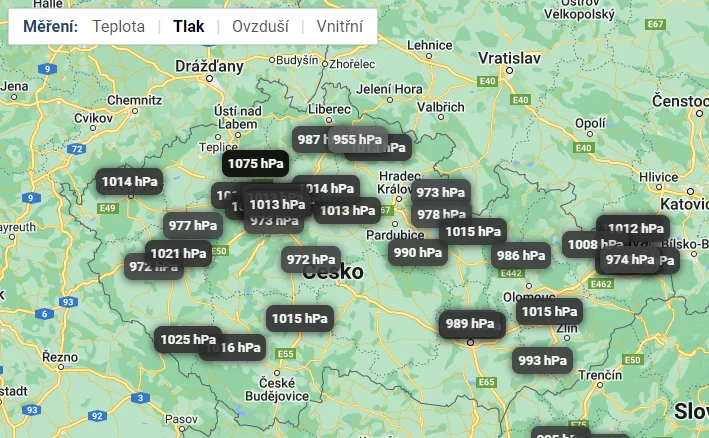
Pressure sensors on map of the world
Now you can also place pressure sensors on your world map. If you have a combined temperature/humidity/pressure sensor that is published on the world map in temperatures, then its pressure measurement can also be found on the atmospheric pressure map.
In addition, the map has been modified for better display on a mobile phone and the colouring has been adjusted according to the measured value to give a finer distinction of the values.
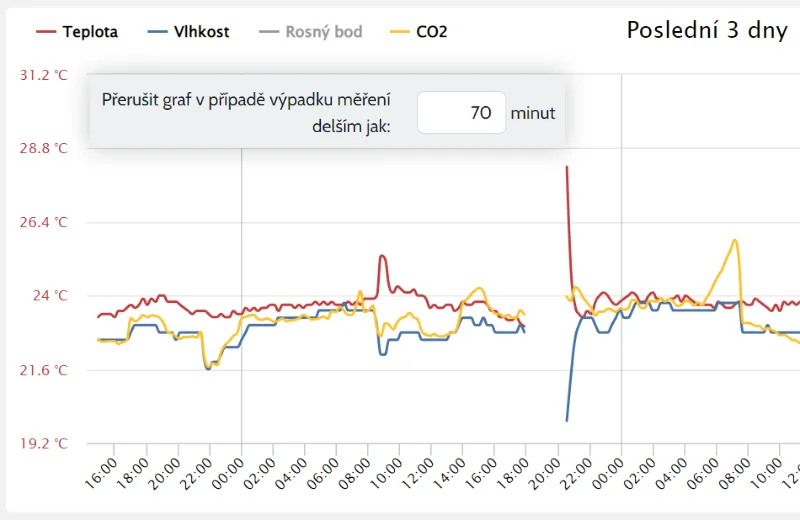
Possibility to interrupt graph when measurements are missing
In graphs "24 hours" and "3 days" on tab "Currently" are all values connected with curve by default, even if there are measurements missing for longer time.
Now you can edit settings at Sensor and set value in minutes (30 is minumum) to interrupt graph in case of a missing measurements.
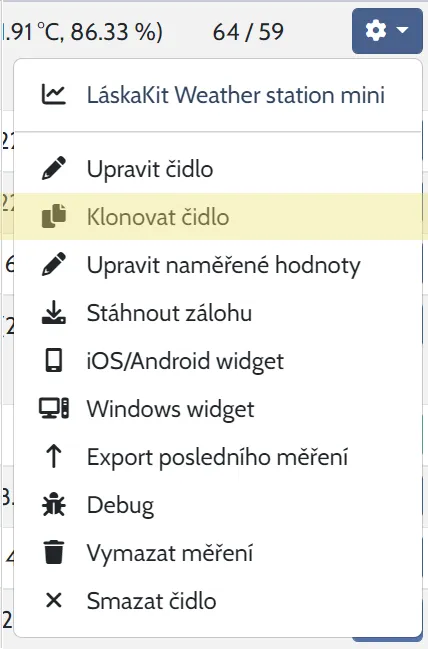
Possibility to clone an existing sensor
Have you tweaked the settings on one sensor and want to add another that is similar? To avoid having to check what you have set up, just clone a specific existing sensor. Then just choose a domain for the stats, edit the name and any little details and you're done.
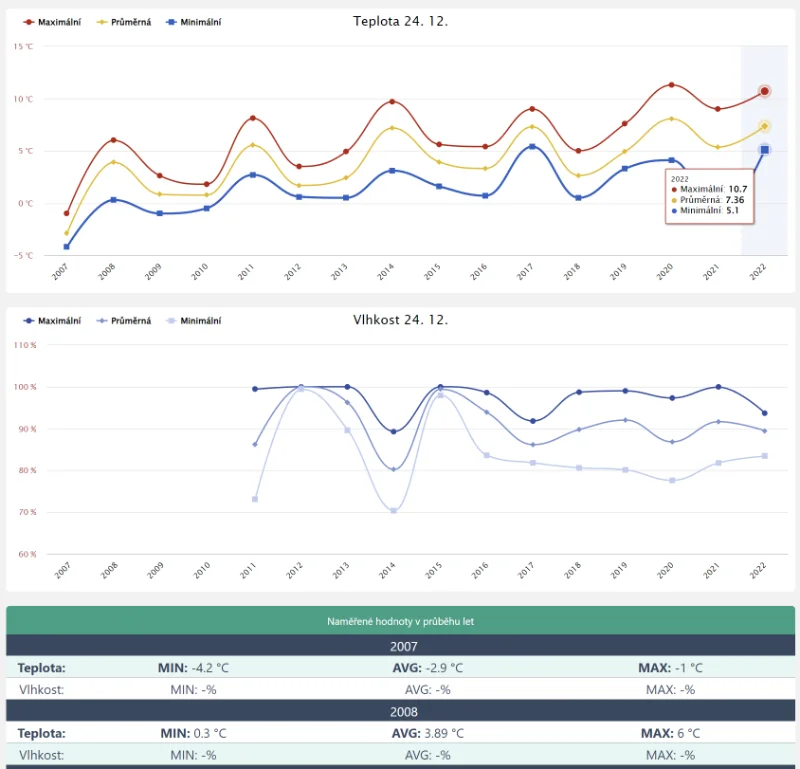
Graph for values over years in daily history
Until now, when you selected a particular day in history, you only had a table on the page with the values that have been measured for that day over the years.
Now you can also find graphs for all measured values.
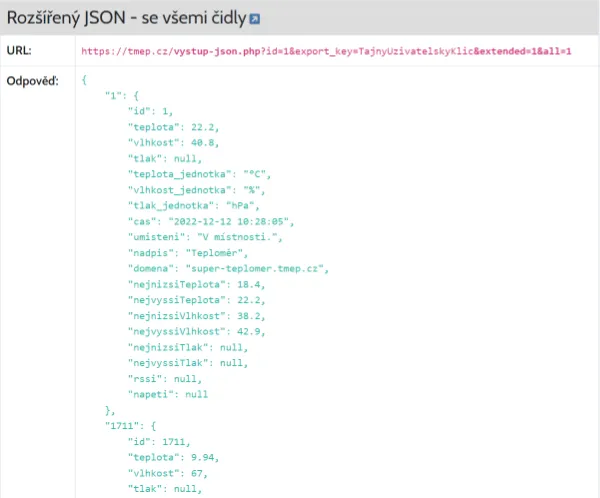
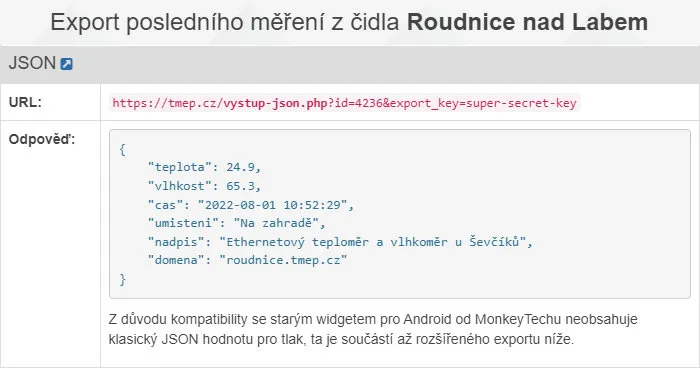
Export of last measurement from all sensors
We have extended the JSON export options. Now you can export info from all sensors at once, whether common or extended. More information can be found in the documentation here .
New integrations
You can now connect TMEP with Home Assistant and Sensor.Community!
Home Assistant - a popular home automation service. It is not a problem to deliver values to HA from TMEP as well as to send them to TMEP. For example, for fancy statistics on temperature (and other variables), this is an ideal scenario. Instructions in the documentation here .
Sensor.Community - TMEP has learned how to process the output from the airRohr firmware, which is used by this service in the devices, so TMEP can be chosen as API for sending data. This way you get rich statistics with history. Instructions in the documentation here .
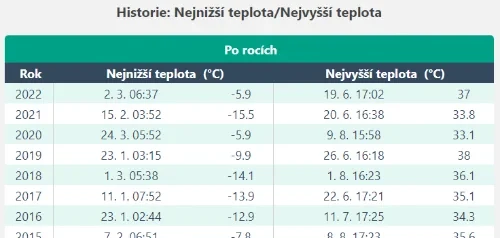
Table of top values by year
In addition to the overall lowest and highest values, you can also find a table of the individual measured years on the highest values tab.
You can also find min/avg/max temperature (humidity, pressure...) data on the annual statistics tab, or you can have a specific day/month listed from the history.
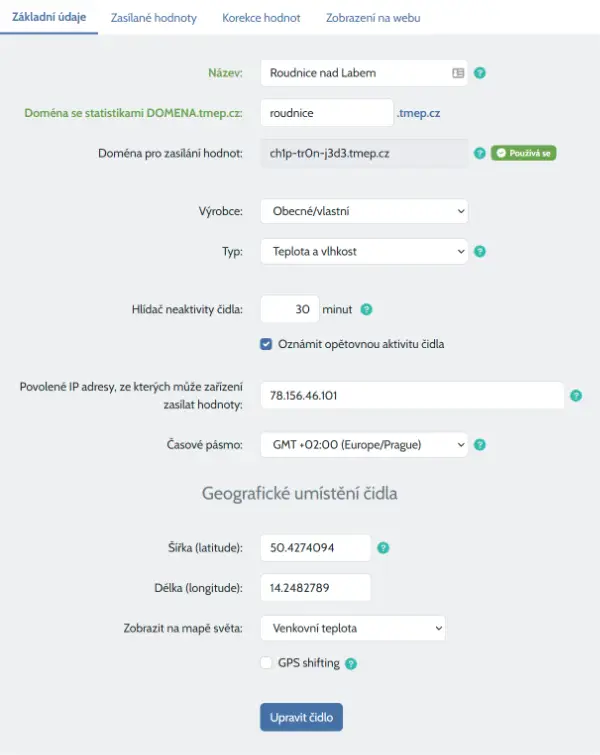
Better sensor settings
Form is now divided into 4 tabs:
- Basic settings
- Values with measurement
- Value correction
- Web settings
The items have been logically rearranged so that the sensor settings make more sense and are clearer. A question mark icon has been added to many of the items to show help for that item when the mouse is hovered over, so you don't have to read the documentation for the service.
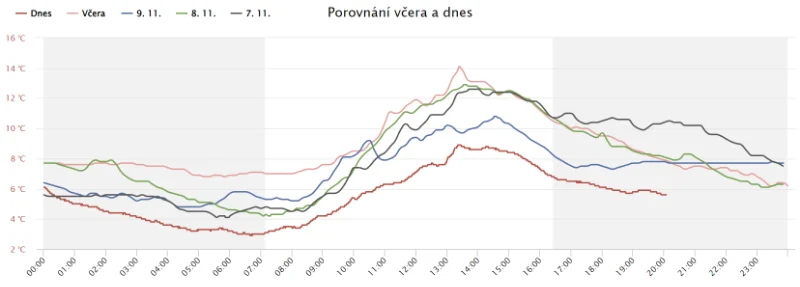
More days in comparison
On the "Comparison of yesterday and today" chart there is a legend for the days "Today" and "Yesterday" and 3 more previous days, which can be activated and displayed in the chart by clicking on them.
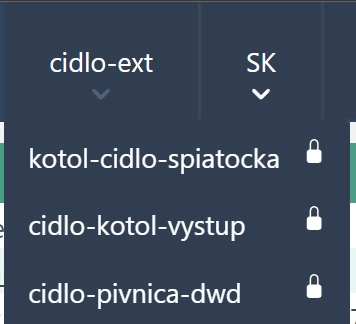
Hidden values of private sensors in menu
If you have a public sensor under an account where other sensors are marked as private, then you will not see the current value in the sensor selection menu without logging in.
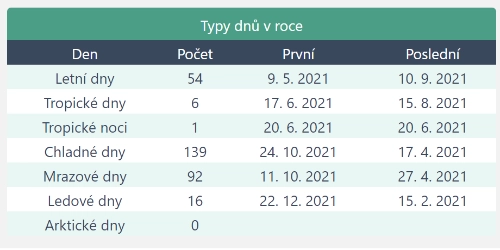
Cold days in annual statistics
The annual statistics were expanded to include Cold Days - those are days when the temperature did not exceed 10 degrees of Celsius. For the lowest/highest minima/maxima, the date when the record occurred has been added. For cold/freezing/ice/arctic days, the last date of the first and last such day of the year are better displayed - the former being in the second half of the year and the latter in the first half.
Overview of sensors with graphs
In the sensor overview there is a new display type "table with graphs" (in addition to the existing "columns" and "table"), where you have a graph of incoming values for three days back under each active sensor. For better clarity, due to the smaller chart space, any second and third values within a sensor are not automatically displayed, but can be enabled by clicking on them in the legend to have them displayed.
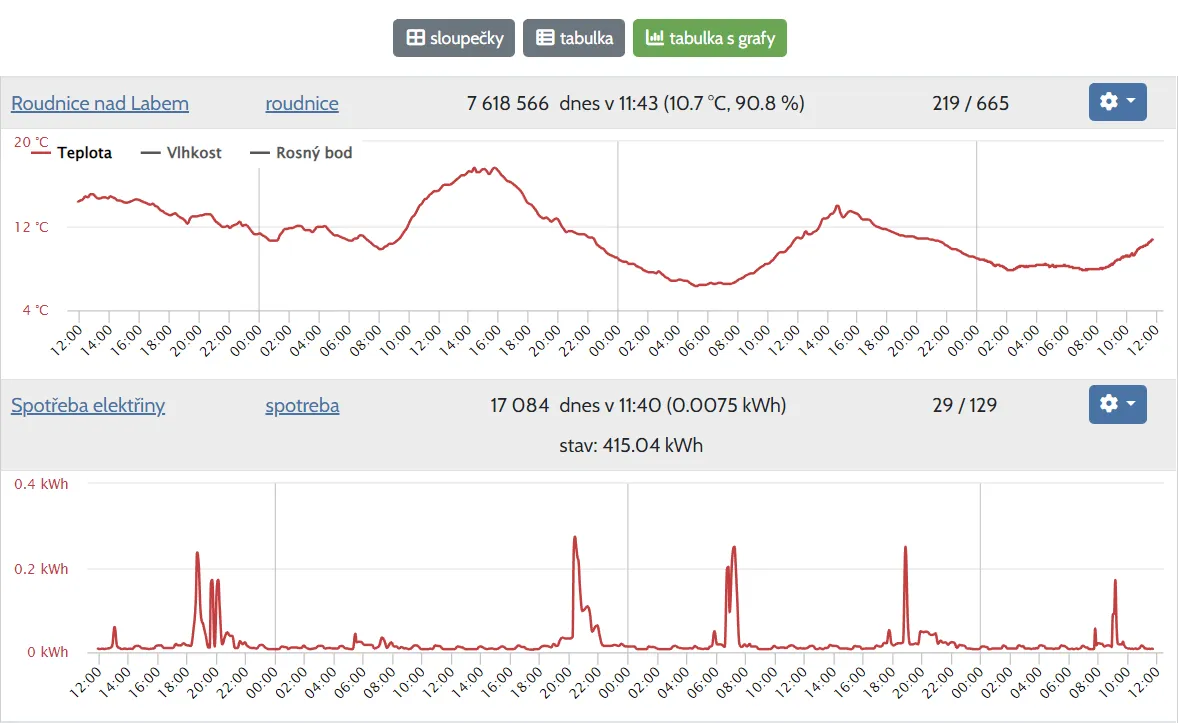
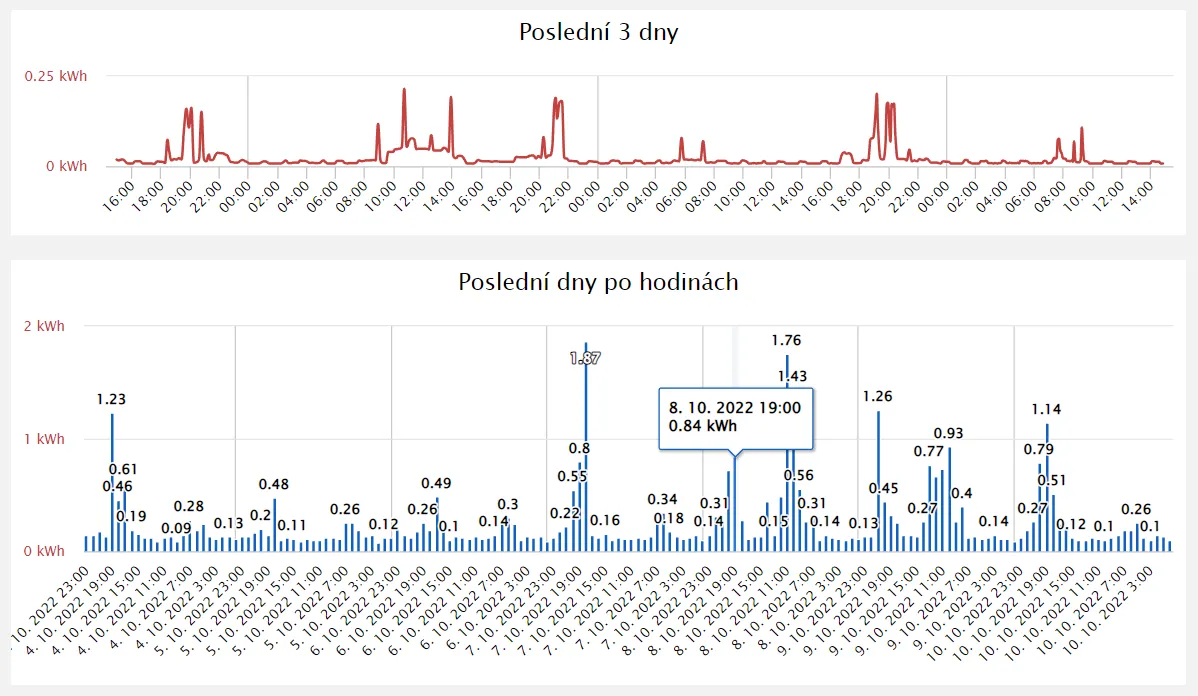
Visualisation of consumption/aggregate values
The option to select the sensor type "Consumption" has been added to the service. Now you can have summary of the sent values displayed in the statistics, including the total status.
You can find script in documentation for inspiration, how to use Raspberry Zero to read pulses from the meter via the S0 pulse output and send the electricity consumption to the service.
The app has gone through several waves of modifications to display this type, but it definitely deserves further improvements. I'll either figure those out gradually by using it, or please write me directly what are you missing.
More world map options for sensor placement
The number of sensors placed on the world map is increasing and a mix of indoor and outdoor sensors is not appropriate. In addition, it is now possible to create a map for a specific measuring. As the first of such maps, we include an air quality map where such sensors can be placed. There is also a choice of indoor and outdoor sensor maps. We will eventually move the indoor ones to where they belong if their owners have not done so by then.
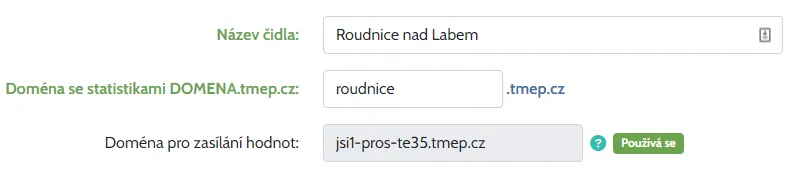
Enhanced security through a unique domain for sending values
Now in the sensor settings you can find a generated domain that you can use for sending values.
Once you set it up in your sensor and a measurement comes in on it, onlly this domain will be used for incoming values.
This feature is especially useful if you do not have the ability to set a unique name for a variable with a measured value and/or restrict incoming measured values to a public IP address.
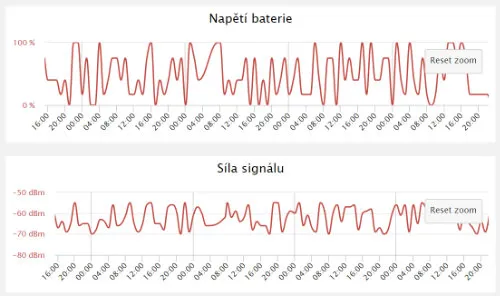
Graph of battery voltage and wi-fi signal
If your sensor is sending this data and you would like to know its history, just turn on these graphs in the current tab and you will see the trend up to 14 days ago.
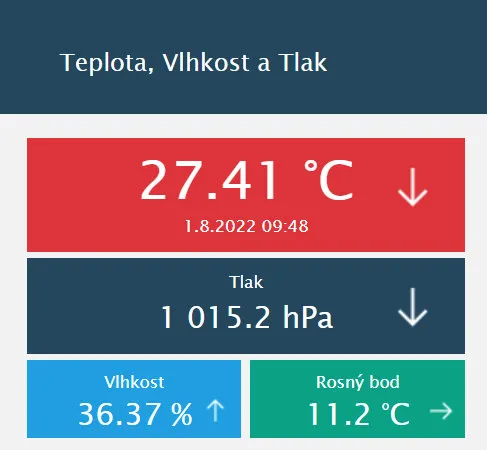
Temperature and humidity are joined by a third value within a single sensor - pressure or CO2
Now you can have 3 values stored and displayed together. Pressure or CO2 is most often most often measured together with temperature and humidity, and TMEP goes along. Of course, the display of the values of pressure/CO2 on graphs and reports.
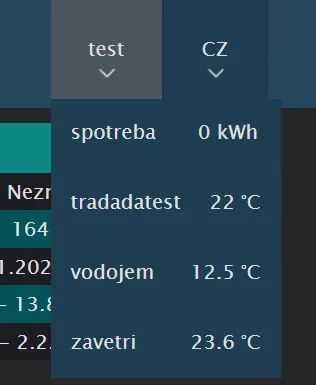
Preview of values in the drop-down menu with sensors
For a better and easier overview (and even a quick comparison with another sensor), you can now find the last value in the list of sensors on the statistics page.
Listing of a specific month on the history tab
Now you can list a specific month from the history and see the values measured on each day.
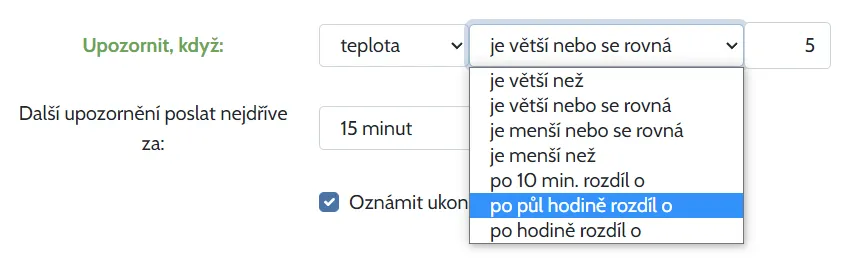
Warning of difference between two measured values
You can now set up an email alert if the current measurement differs by more than your set value from the previous value 10 minutes, half an hour or an hour ago.
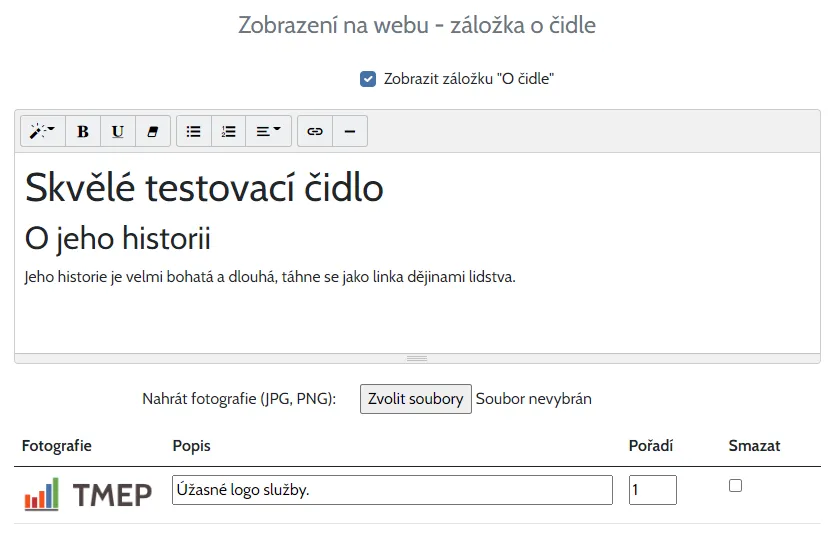
Custom tab "About sensor" on the statistics page
With this feature, you can add stories and photos about your sensor, which will appear on a separate "About sensor" tab on the stats page. There is also a simple editor for basic text formatting. You can simply show off what your site looks like and add other information, including links to your website, etc.
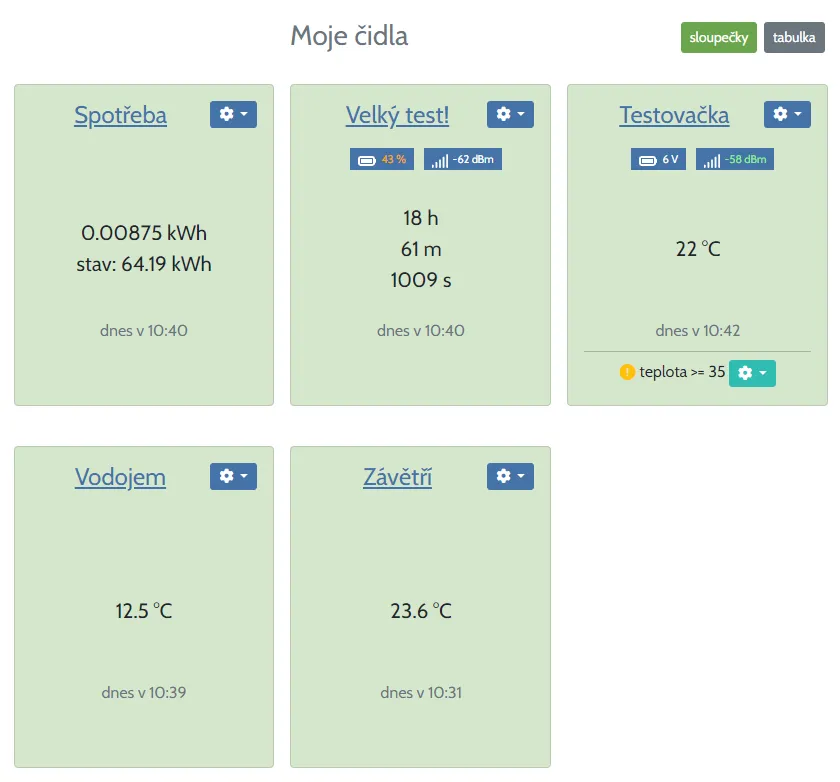
New type of sensor overview display in administration
Sometimes it can be clearer/nicer to have your sensors displayed in boxes by columns, in which case you may find the new column view option useful.
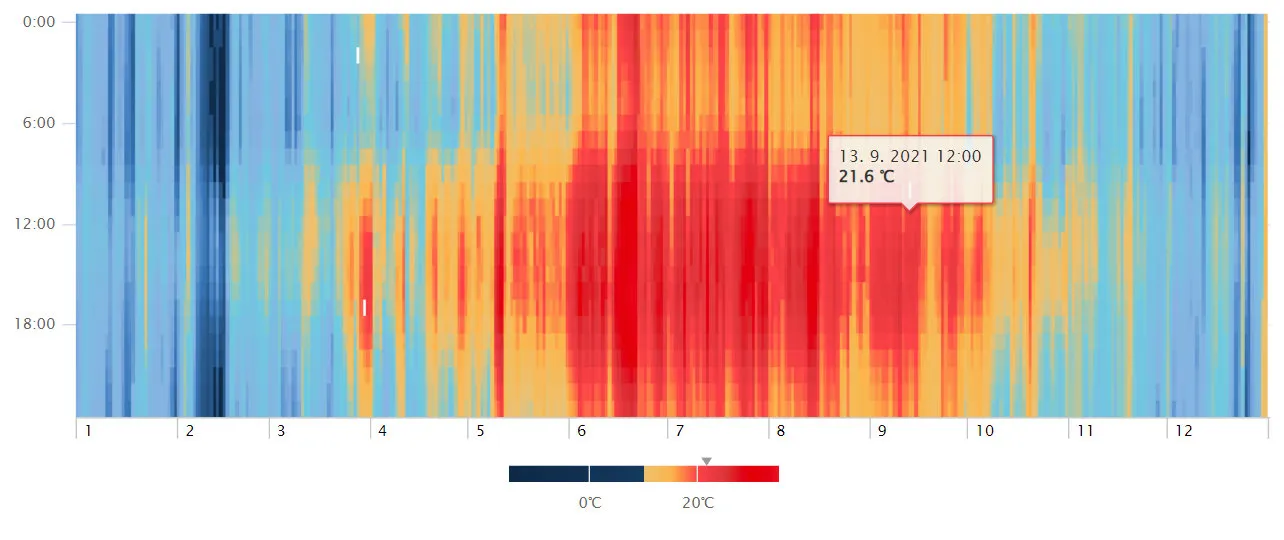
New annual temperature chart - by day and hour
A great overview of temperatures throughout the year on a graph where every column is a day and every row in a column is an hour. This gives you an overview of how you have been measuring throughout the year. Just click on a specific year in the yearly graphs tab.
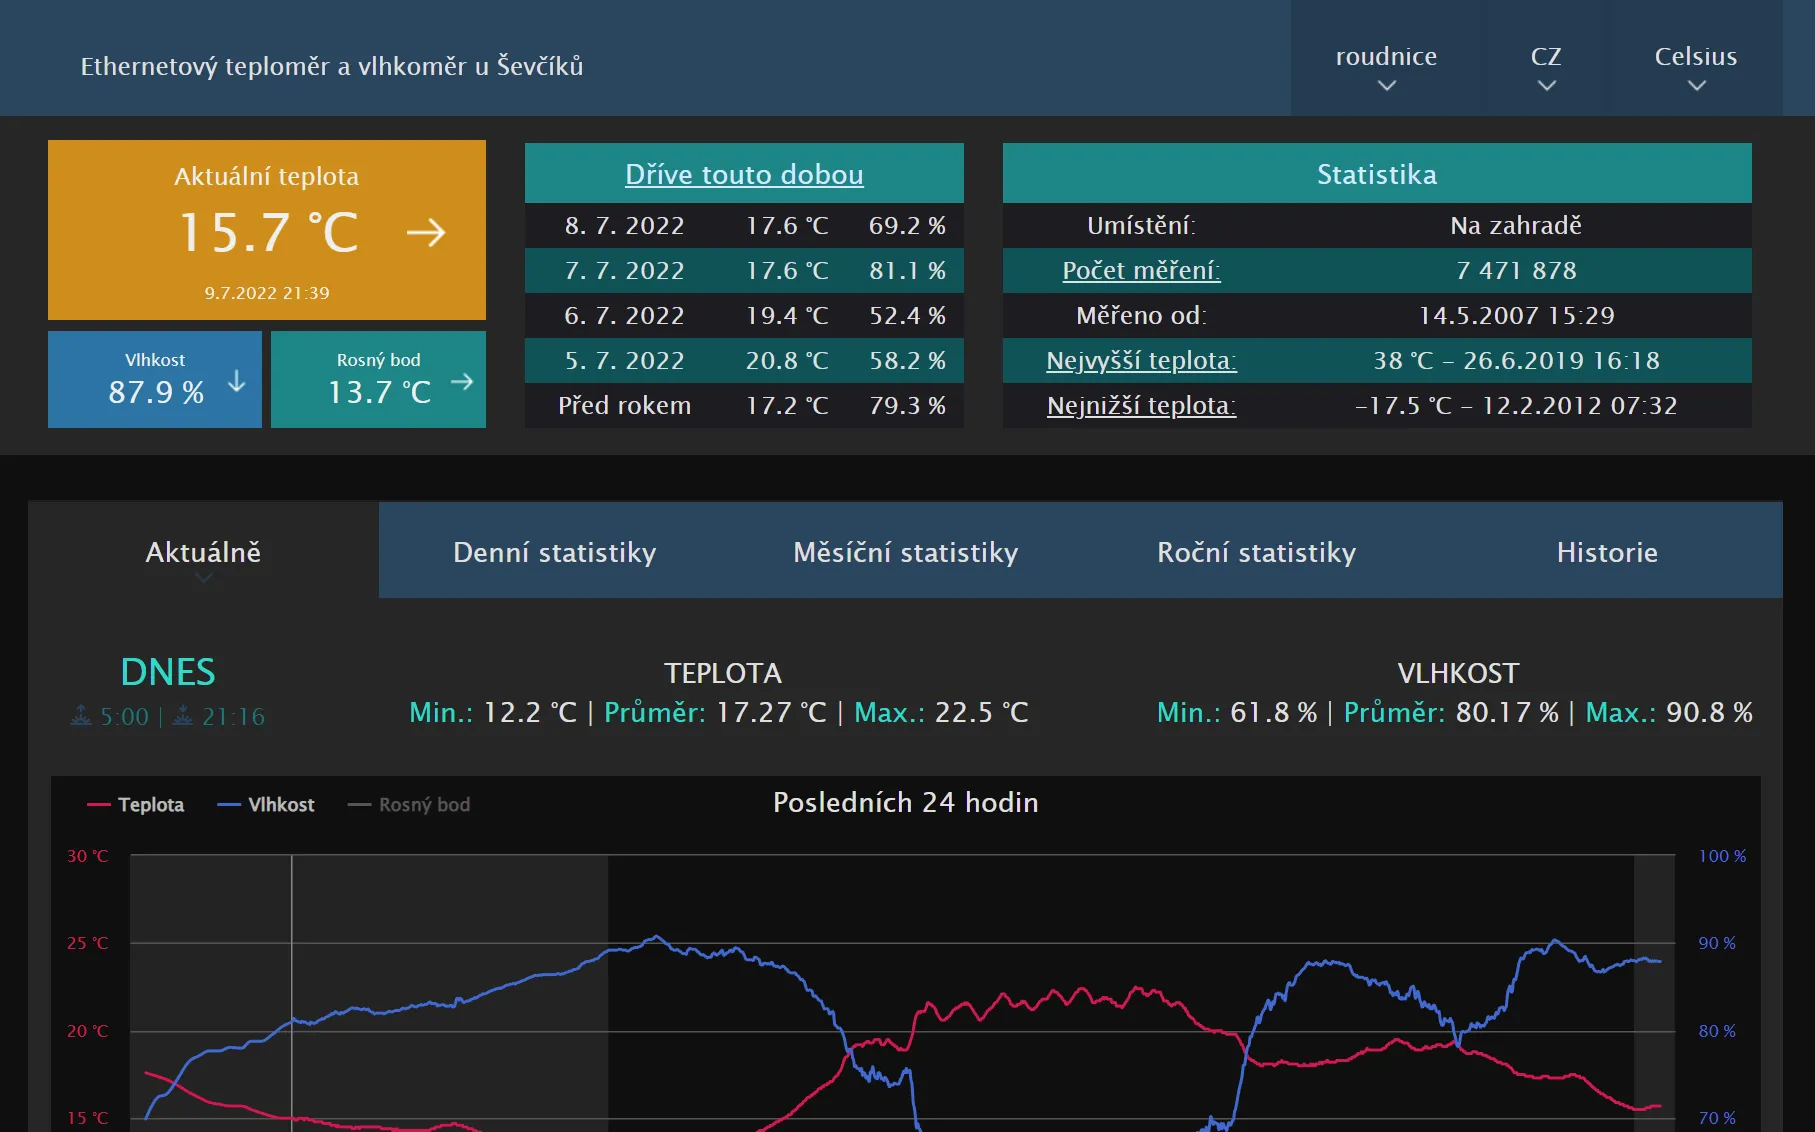
Dark mode
Do you prefer a dark theme? No problem - you can set it individually for the sensors. In particular, clicking from the also dark mobile app view on your phone to the sensor statistics is then more pleasant.
Representation of the night on the charts Currently
In the sensor settings, you can turn on the representation of the night on the graphs on the Current tab. For this function, you need to have the coordinates of the sensor location filled in, as they are used to calculate sunrise and sunset for a specific day. Now you can have the coordinates filled in and not have the sensor displayed on the world map.
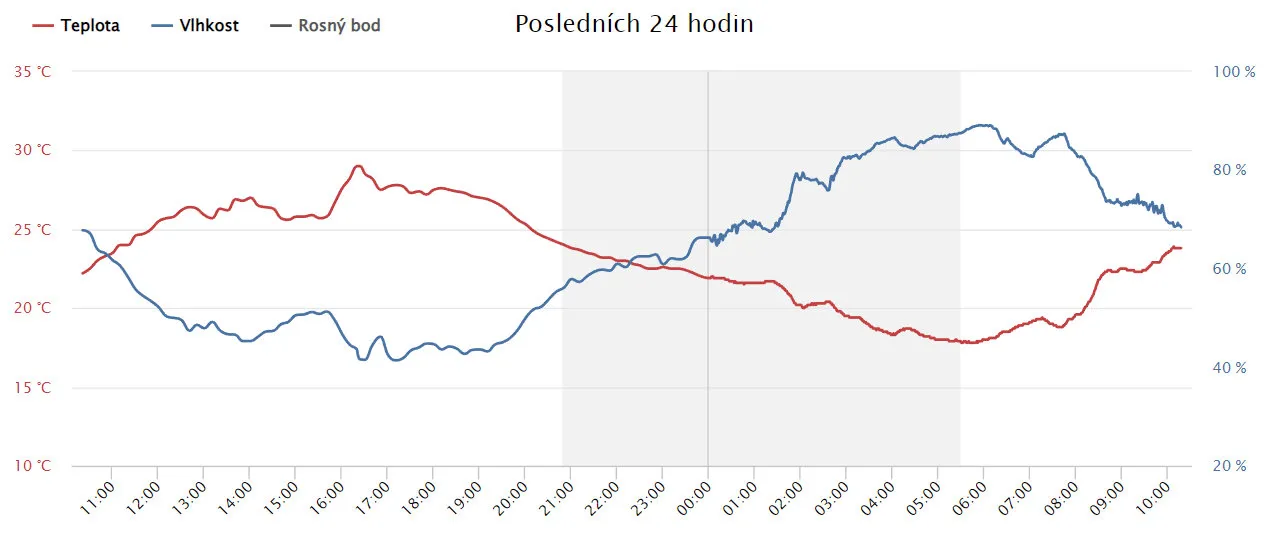
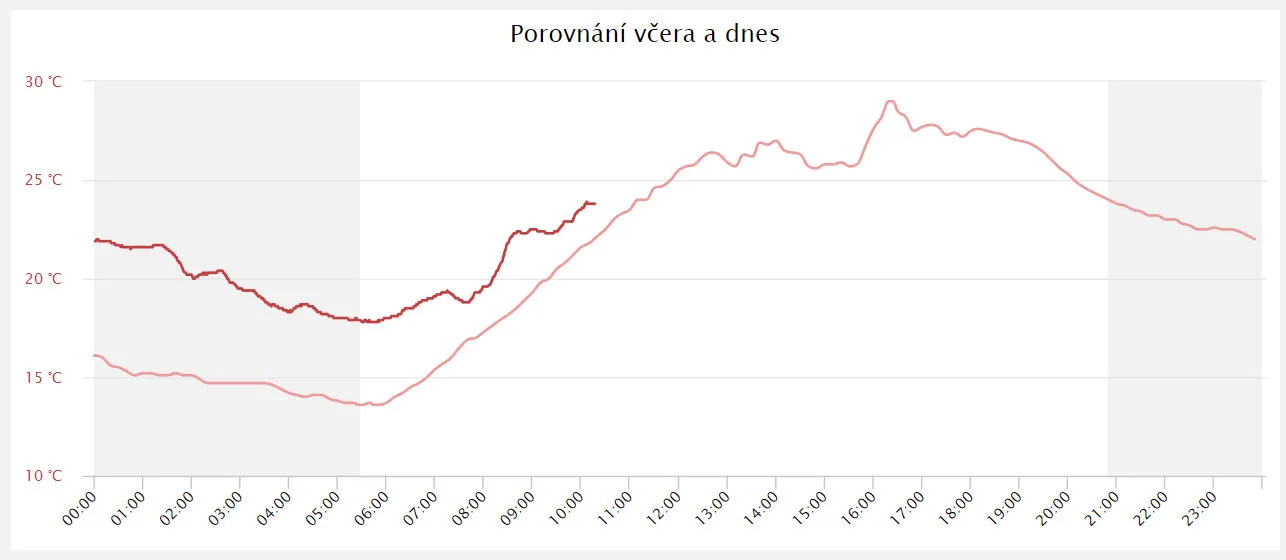
Chart comparing the last two days
In the sensor settings, turn on the display of the measured temperature for today and yesterday in the Current tab so you can see how much the temperature at what time differs from the previous day.
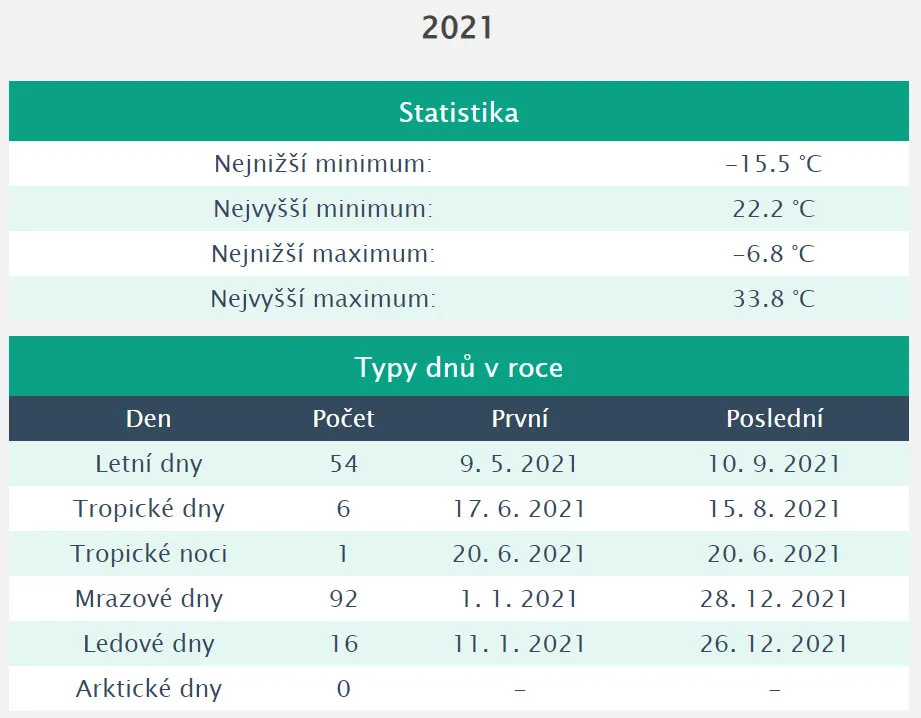
New yearly statistics
By clicking on a specific year in the annual statistics tab, you can now see the lowest and highest minimum, lowest and highest maximum and the number of the following types of days/nights for that year:
- Summer days - Temperature reached or exceeded 25 deg. C.
- Tropical days - Temperature reached or exceeded 30 st. C.
- Tropical nights - Temperature did not fall below 20 deg. C.
- Frost days - Temperature dropped below 0 deg. C.
- Frost days - Temperature was below 0 deg. C.
- Arctic days - Temperature was below -10 deg. C.
This includes information about the first and last day of the year.
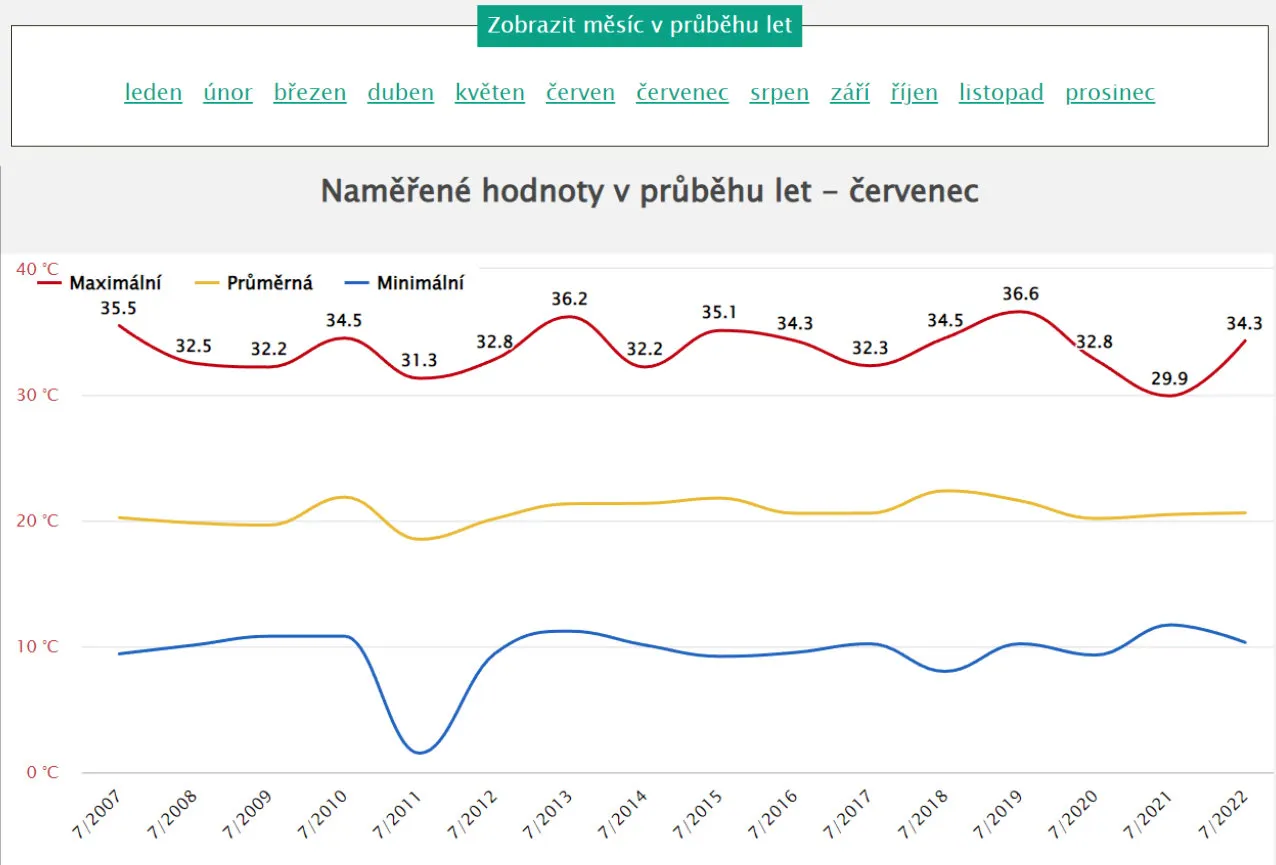
Comparison of measured values for a specific month of the year
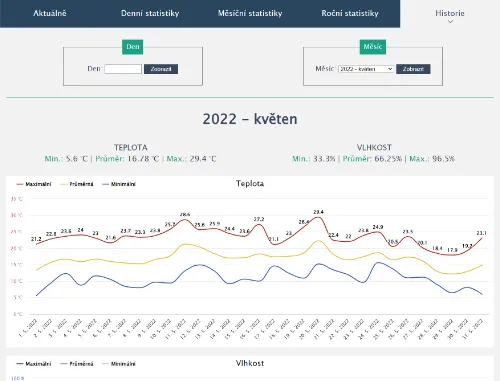
You now have the option to view monthly values over the years for a specific month from the monthly statistics tab.
More manufacturers support TMEP:
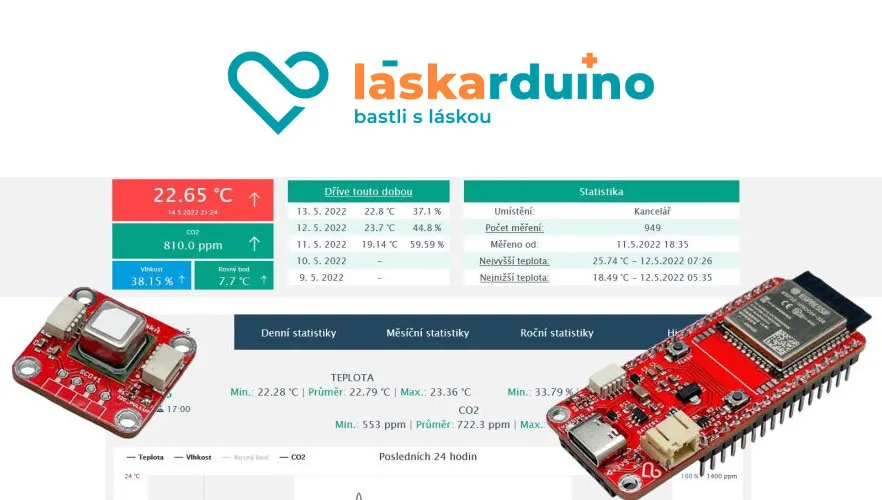
LáskaKit a Teploty.info
Family of supported sensors is growing, after Brrr.cz and HomeTechnologies, there is popular e-shop LáskaKit and sensors
Teploty.info.
LáskaKit also prepared two step-by-step instructions how to get their products live with TMEP (in Czech language):
Jednoduchá vizualizace dat na
TMEP.cz s ESP32-LPkit a čidlem CO2, teploty, vlhkosti SCD41
Senzor prachových
částic IKEA VINDRIKTNING vylepšený o čidlo CO2, teploty, vlhkosti, Bluetooth, Wi-Fi komunikaci a s vizualizací dat na TMEP.CZ
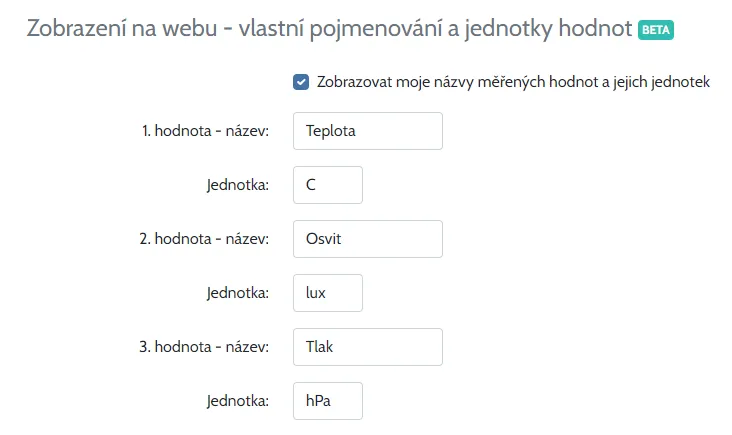
Custom naming of measured values
If you want to send your own up to 3 different measurements on one page with statistics and you don't like some of the preset templates (e.g. temperature/humidity/pressure), then thanks to this feature you can now name the measurements and their units as you like. With custom naming you can create your own mix of measured values.
Ability to edit measured data
It can happen exceptionally that the device sends a nonsensical value which then corrupts the statistics. What to do in such a case? For a long time it was not possible to manually adjust the measured values and although this is a rather demanding operation, it is now possible. In the administration of the sensor you can select "Edit measurement" and manually correct the value. More info in documentation here (Czech language).
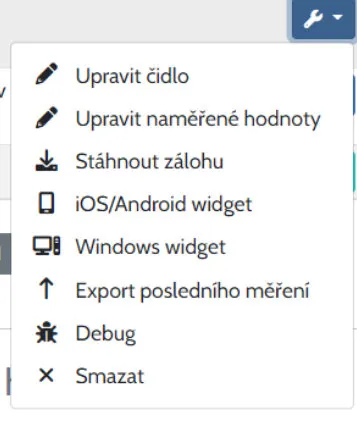
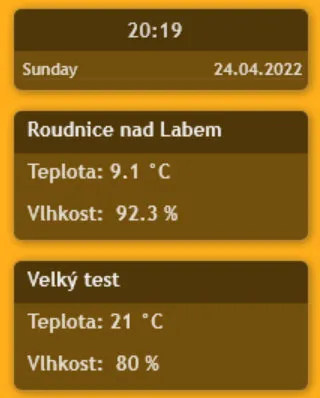
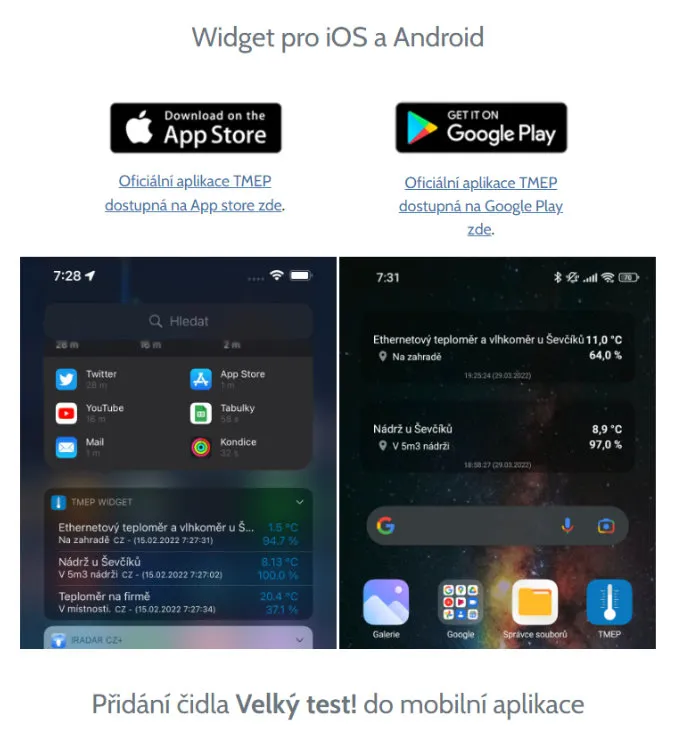
Widget for Windows
With the Rainmeter app, you can place the TMEP widget on your Windows desktop and have the sensor information right at your fingertips. To make the installation of the TMEP widget as easy as possible, you can copy the Rainmeter configuration file from the administration. More info in documentation here (Czech language).
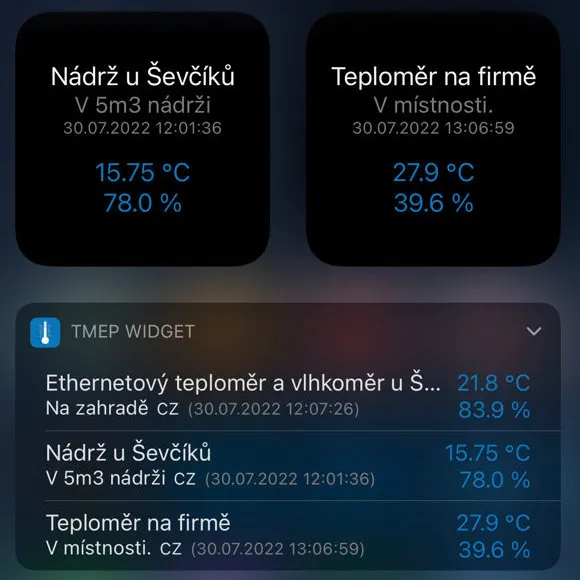
New and improved mobile apps
You can find on both Google Play and Apple App store new TMEP applications, which are improvement of those original ones from MonkeyTech. They can display a third value at the sensor (typically pressure/CO2), support units other than degrees Celsius for the sensor, and in the case of iOS, there are new modern widgets that can be placed on the app desktop.
App optimized for better performance
The display of statistics was sometimes not as fast as it should be. The app has undergone a number of optimizations to make the stats display on the sensor really lightning fast.
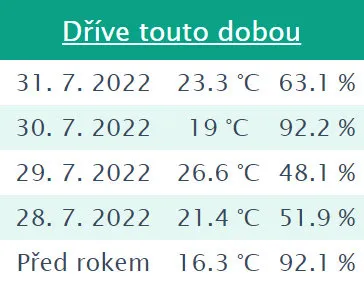
Expanded info for "Earlier this time"
On the sensor statistics page, you can see in the application header a few days back what the values were on earlier days at the same time. Now you can compare the current situation with what the value was a year ago (if you have measurements for that time). For earlier days, the value is now not taken to tens of minutes, but easily to an hour if there is no more accurate measurement. So for sensors that send the value e.g. just once an hour, you will also get this information. In addition, by clicking on "Earlier this time" you will see an extended history not only for the last days, but also for all measured years back.
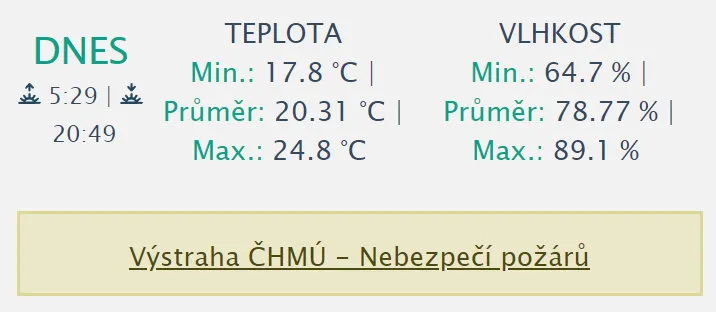
Integrated alerts from CHMÚ
CHMÚ is Czech Hydrometeorological Institute - so alerts data are for Czech republic only.
You can select the municipality under which the sensor falls and then you will see any warnings issued by the Czech Hydrometeorological Institute on the Current tab.
Improved page for adding a sensor to the mobile app
Now you can also find values for manual addition and the page has been made clearer.
Display battery voltage and wi-fi signal strength from the sensor
If your sensor supports this and sends these values, you will now see information on the page about the wi-fi signal strength and battery status. If you set a battery voltage range from-to in the admin for your sensor, it will show the current battery capacity in percentage. Additionally, you can have an email alert sent to you if the battery voltage drops below a certain level.
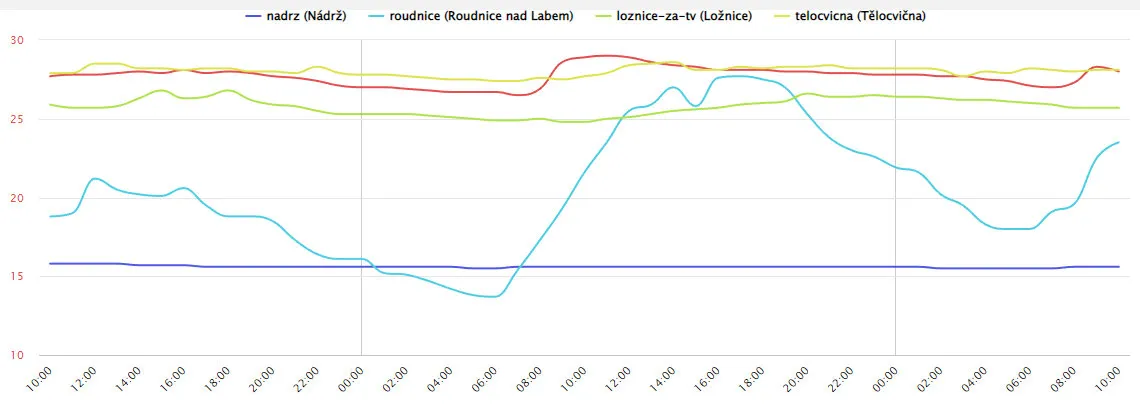
Overview of all sensors in one graph
Would you like to see the main values from all sensors for comparison? No problem! After logging in to the administration on the sensor overview you have this graph. You can now have it displayed on the statistics page for any sensor. Just enable this option in the settings of the currently tab.
New page for downloading backups from the sensor and exporting the last value
You can easily and clearly download a backup of the measured values from the sensor in a specific format on one page. Similarly, the new page for exporting the last sensor value gives you a preview of what the export looks like without having to look at the service documentation.
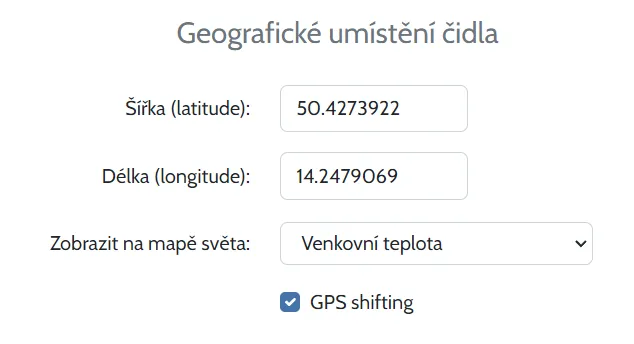
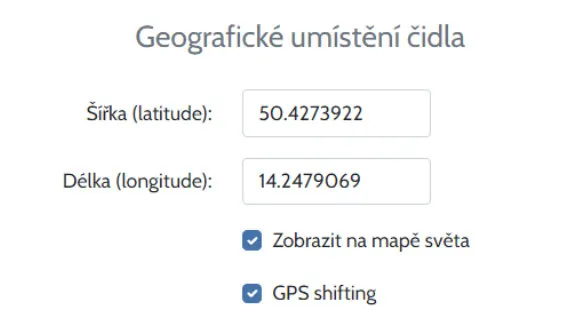
World map display with GPS shifting
Would you like to present your sensor measurements on a world map, but don't want to show the exact location of the sensor? Enable the GPS shifting function in the sensor's administration and every time the map is displayed, the sensor's position will be randomly shifted by up to a few hundred meters.
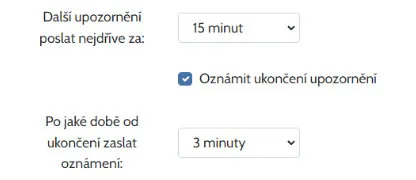
New alerts and email notifications
You can set up an email notification not only to notify you when a sensor is unavailable, but also to notify you when it is available again. Similarly, you can have an alert sent to you when a reading is taken to let you know that everything is OK and the alert is no longer current. Does your sensor send battery voltage information? You can have an alert sent to you when the voltage reading falls below a certain threshold.
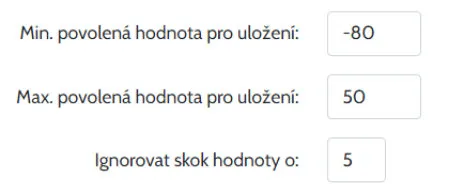
Protection against storing a meaningless measured value
Almost from the beginning of the service, it is possible to define a range of minimum and maximum permissible values from the sensor. Values outside this range are not stored to avoid nonsense. In 99% this is sufficient protection, but you can go further if you want. You can set how much the new value must not differ from the previous one and for how long. For example, you can configure that the temperature value must not differ from the previous one by more than 10 degrees, but for a maximum of 30 minutes. If even after half an hour the temperature comes up with such a big difference, it will be considered legitimate and will be saved.